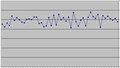
What do you think the oscillations say (where are the DPC statisticians? We need them here...:-)?
Perhaps the Sub-Club can help iron out these oscillations...:-)
Oh and feel free to post your chart here too.. perhaps we will gain some collective insight?
(All I did was copied the scores from my profile page, sorted in ascending order, pasted them into MS Excel, and plotted the chart.)
ETA: The objective is to look at how I am improving/deteriorating in the quality of entries w.r.t. the scores, and how to make the trend more upward so the axis of oscillations moves up from 5.0. And if in the process, I can look at someone who has improved a lot over time, that would be interesting too.
ETA:
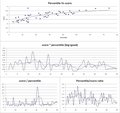
Niall (NiallOTuama) prepared these additional charts from my scores...
Looks like a fairly normal score distribution, with general upward tendency. Not sure of the point you are making, but I'll play. Give me a few minutes...
Looks like a fairly normal score distribution, with general upward tendency. Not sure of the point you are making, but I'll play. Give me a few minutes...
Thanks Steve. I am not trying to make a point. I am only trying to understand the chart, thought it would be interesting to see how this one compares to that of someone who has been improving consistently:-)
I'd say that you need to normalize this based on open/members only challenges/Free Study, as clearly there are a different set of expectations and voter behaviors in each that are distinct and significant.
I'd say that you need to normalize this based on open/members only challenges/Free Study, as clearly there are a different set of expectations and voter behaviors in each that are distinct and significant.
-CB
True Cory. However, the axis about which the curve oscillates can generally tell you about how talented the photographer is? E.g Steve's oscillate around a high 5's line, but mine around the high 4's line.
Also, are these all the scores? I was wondering if you were ever in the 4's land (may be never:-) and then it slowly improved?
First entry was 5.26, second was 4.77. Mostly a mix of low to mid 5's and a few 4's for a while. Hit my first 6 at challenge #16, which unbelievably, was a freestudy. Took me almost 2 years to hit 6 in a freestudy again.
If you want to see fours, then check my results. I can't chart my scores, but if anyone else wants to it's OK with me -- should look rather like the profile of an upside-down crosscut saw ... :-)
Also, are these all the scores? I was wondering if you were ever in the 4's land (may be never:-) and then it slowly improved?
First entry was 5.26, second was 4.77. Mostly a mix of low to mid 5's and a few 4's for a while. Hit my first 6 at challenge #16, which unbelievably, was a freestudy. Took me almost 2 years to hit 6 in a freestudy again.
You made me go look at my stats...
Apparently, I hit my first 6 in a free study (although it took me 25 entries...), after 4 months here, and I (unbelievably!) repeated the performance again in the next months' free study. This month's will not perform as well I suspect..
Although that wasn't really my first 6.. That was my 9th entry.. Barely cracked a 6...
Five of my first six entries were in the 4 range... Not exactly a stellar start.
If you want to see fours, then check my results. I can't chart my scores, but if anyone else wants to it's OK with me -- should look rather like the profile of an upside-down crosscut saw ... :-)
Same goes for my stats... I'm simply too busy to chart them today (shouldn't even be messing about in the forums... But I'm on hold...).. But if anyone else should want to, then please do feel free, I won't take an offense no matter how erratic it looks..
There's always going to be some variation in anything. With enough data you should get a trend. Like those histograms you get during those challenges. You should have a well enough defined mean and a standard deviation.
You could guess your next scores if you had enough data :)
I wonder. Are these nice plots against the ToU, technically?
4.6: "Except as expressly set forth herein, you may not reproduce or distribute any information available from the Website, electronically or otherwise. You shall not store or aggregate such information in any manner."
There's always going to be some variation in anything. With enough data you should get a trend. Like those histograms you get during those challenges. You should have a well enough defined mean and a standard deviation.
You could guess your next scores if you had enough data :)
I wonder. Are these nice plots against the ToU, technically?
4.6: "Except as expressly set forth herein, you may not reproduce or distribute any information available from the Website, electronically or otherwise. You shall not store or aggregate such information in any manner."
Re: ToU violations, I am not sure, Niall. I would think that since the scores are publicly available on member profiles, and we are only sharing it within the forums, it should be ok?
Re: ToU violations, I am not sure, Niall. I would think that since the scores are publicly available on member profiles, and we are only sharing it within the forums, it should be ok?
ETA: How did you normalize the scores?
I was mostly joking :)
The normalised position would, I suppose, be better named as the entry's percentile. You know the % in the list of entries. X% means you did better than X% of the other participants. Or at least that's what I think.
I called it normalised cause I scaled it between 1 and 10 instead of 1 and 100. I should look up more info about numerous axes in google spreadsheets. Or maybe it'd be better to scale everything between 0 and 1.
Re: ToU violations, I am not sure, Niall. I would think that since the scores are publicly available on member profiles, and we are only sharing it within the forums, it should be ok?
ETA: How did you normalize the scores?
I was mostly joking :)
The normalised position would, I suppose, be better named as the entry's percentile. You know the % in the list of entries. X% means you did better than X% of the other participants. Or at least that's what I think.
I called it normalised cause I scaled it between 1 and 10 instead of 1 and 100. I should look up more info about numerous axes in google spreadsheets. Or maybe it'd be better to scale everything between 0 and 1.
Edit: Done.
Yes. Good point. I should've thought of that before:-)
Of course this will all become perfect if the number of (and even themselves) participants remained the same throughout...